


Did you know that mobile users spent 4.2 trillion hours in mobile apps in 2024 alone, with projections pointing to over 300 billion app downloads in 2025?
Yes, that's 4.2 trillion hours, a clear sign that mobile apps have taken over our daily lives. From social media and gaming to finance and fitness, users are glued to their screens more than ever before.
In this blog post, we’ll explore 100+ top mobile app development statistics covering downloads, market growth, retention rates, and much more to help you understand what’s trending in 2025.
Let’s start!
Mobile App Development Market Statistics
Global Market Size and Growth
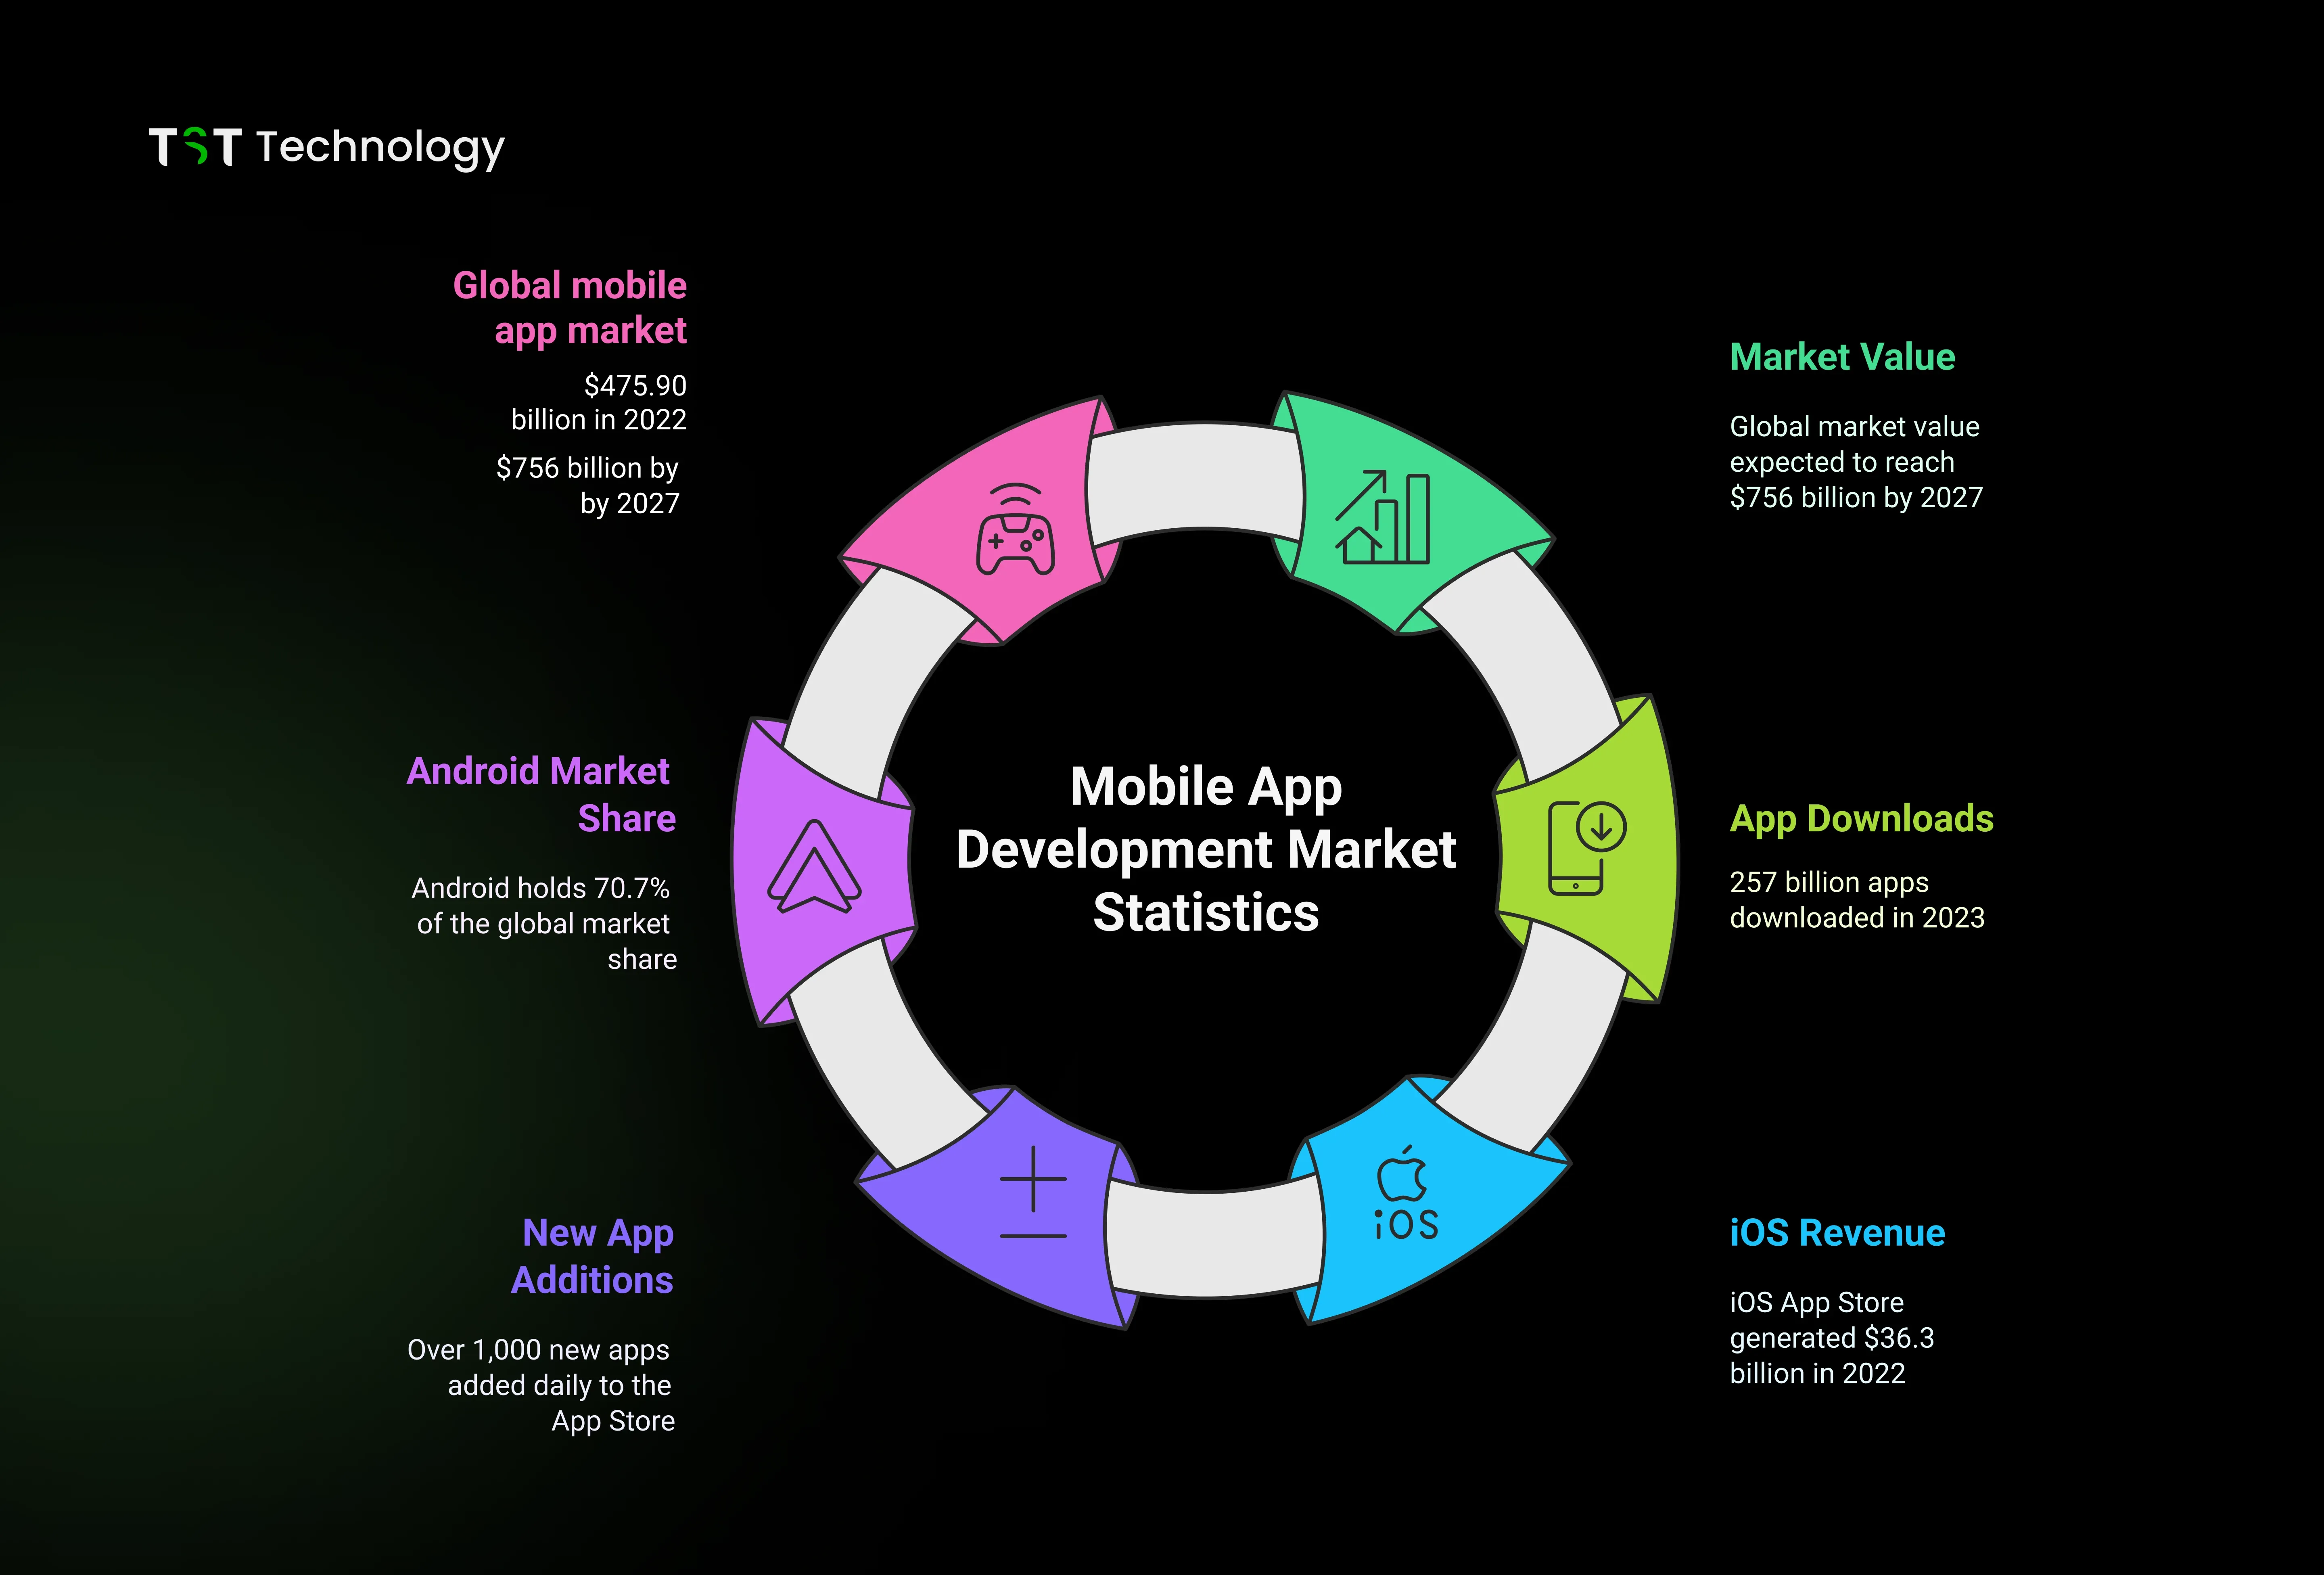
The mobile app market was worth $475.90 billion in 2022.
The mobile app market is projected to reach approximately $756 billion by 2027, growing steadily at a rate of around 8.58% annually. The app development industry itself could reach nearly $583 billion by 2030, with a yearly growth rate of 12.8%.
Global App Downloads
- In 2023, over 257 billion mobile apps were downloaded worldwide.
- Between 2019 and 2020, users downloaded over 250 million mobile apps each day worldwide.
- Every day, the App Store sees the addition of more than 1,000 new apps on average.
Top Regions for Downloads
- India and China made up 65% of all global app downloads last year.
- India led the world in mobile game downloads, with 726 million downloads in 2023.
- The US and Brazil were next in line for game app downloads.
iOS vs Android App Revenue
- Despite having fewer downloads, iOS continues to dominate revenue generation.
- In 2024, the Apple App Store generated approximately $98 billion in consumer spending, compared to Google Play's $48 billion, showcasing iOS users' significantly higher willingness to pay.
Mobile Gaming App Statistics
- Mobile gaming will reach $118.90 billion by 2027, with a 6.39% CAGR.
- The number of mobile game users is expected to grow to 1.9 billion by 2027.
- In 2023, mobile game downloads totaled 4.02 billion, led by India.
Android vs iOS Market Share
- Globally, Android has a 70.7% market share (Q1 2024).
- In the US, iOS leads with 59%, and Android has 40.9%.
- In the UK, Android holds 50.1%, and iOS is close behind at 49.3%.
Mobile App Usage Statistics
Understanding mobile app usage is essential for businesses to improve user experience, discover new trends, and make strategic decisions.
These statistics provide deep insights into how users interact with mobile apps, the most popular app categories, and when users engage with different apps the most.
Daily App Usage Habits
- In 2025, users spend an average of 4.9 hours daily on mobile apps, opening apps approximately 35 times per day with an average session length of 18.5 minutes.
- 77% of app time is spent on a user’s top 3 apps.
- About 84% of users look at their phones within the first 15 minutes after waking up.
- 71% of professionals check work apps before 8 AM, and 44% still check them after 11 PM.
App User Behavior & Usage Habits
- Most users have over 80 apps on their phones, but they regularly use only a small number of them. 1 in 4 users deletes an app after a single use. Only 3% of apps retain active users after 30 days.
- This is where exceptional UI/UX design becomes critical. Apps with intuitive interfaces, smooth onboarding, and user-centric experiences see significantly higher retention rates. Learn more about how good UX design differs from bad UX design and discover proven strategies to keep users engaged beyond the first interaction.
- 47,000 Android apps and 39,000 iOS apps are launched monthly.
- The top reason for uninstalling apps is a lack of use or a poor user experience.
- 88% of users uninstall apps if they crash or have bugs.
- Users typically have 60–90 apps installed, but use 9 daily and 30 monthly.
App Usage by Category
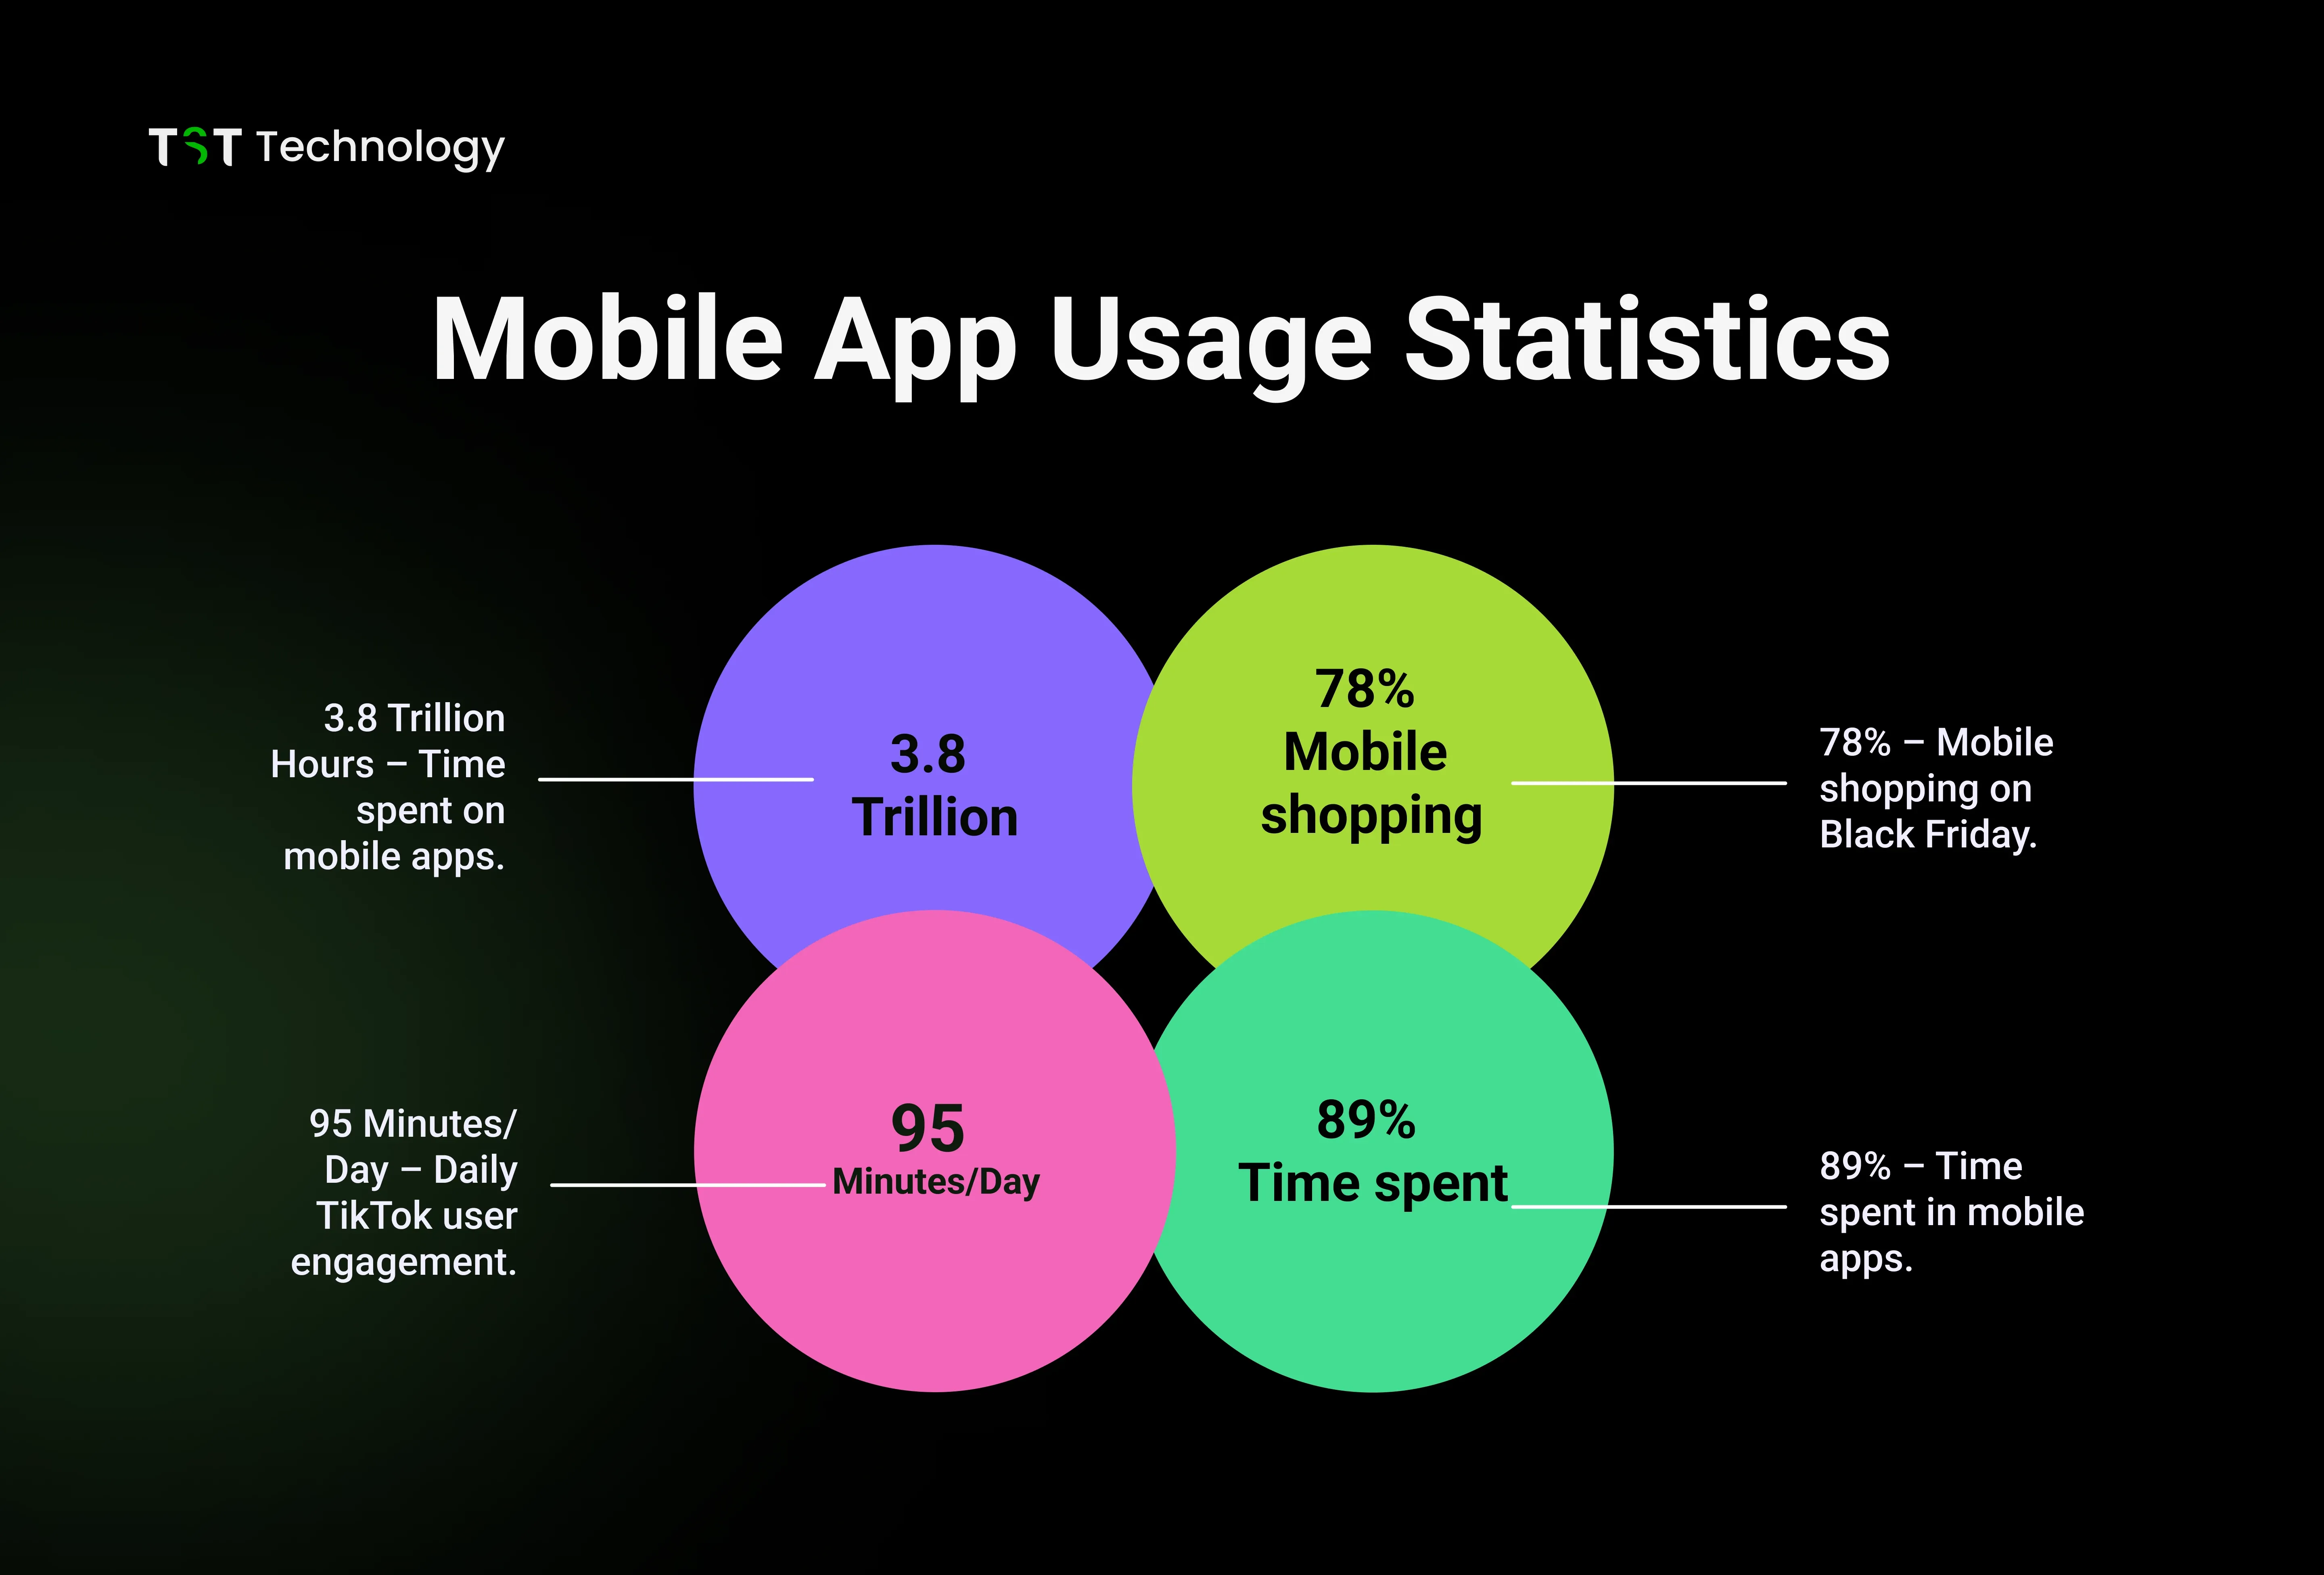
- People spend 89% of their smartphone time using apps, and just 11% browsing the mobile web.
- Social media and messaging apps are the most used app categories.
- Gaming apps dominate evening hours, especially around 8 PM.
- Health, fitness, and productivity apps are rising due to a wellness focus.
Social and Entertainment App Trends
- Users aged 16–24 spend 3.8 hours/day on social apps, equal to 57 days/year.
- TikTok users spend 95 minutes/day, Instagram: 51 mins, X (Twitter): 29 mins.
- Microsoft Teams has 250M monthly active users.
Mobile Commerce and Shopping Apps
- Mobile commerce usage jumped 69% in one year.
- Users have around 13 shopping apps, but mainly use only 3.
- On Black Friday 2023, 78% of online shopping was done via mobile apps.
Global App Activity Insights
- 3.8 trillion hours were spent on mobile apps in 2022.
- As of 2023, there are 6.9 billion smartphone users globally.
- Android users spend over 90% of their mobile time inside apps.
- Video traffic accounts for 73% of mobile data use, led by YouTube and TikTok.
Mobile App Revenue Statistics
Mobile apps have evolved into a billion-dollar industry, reshaping how companies generate income. From gaming to health apps, every category has seen massive growth.
Here's a breakdown of the most important revenue insights:
Global Mobile App Revenue Overview
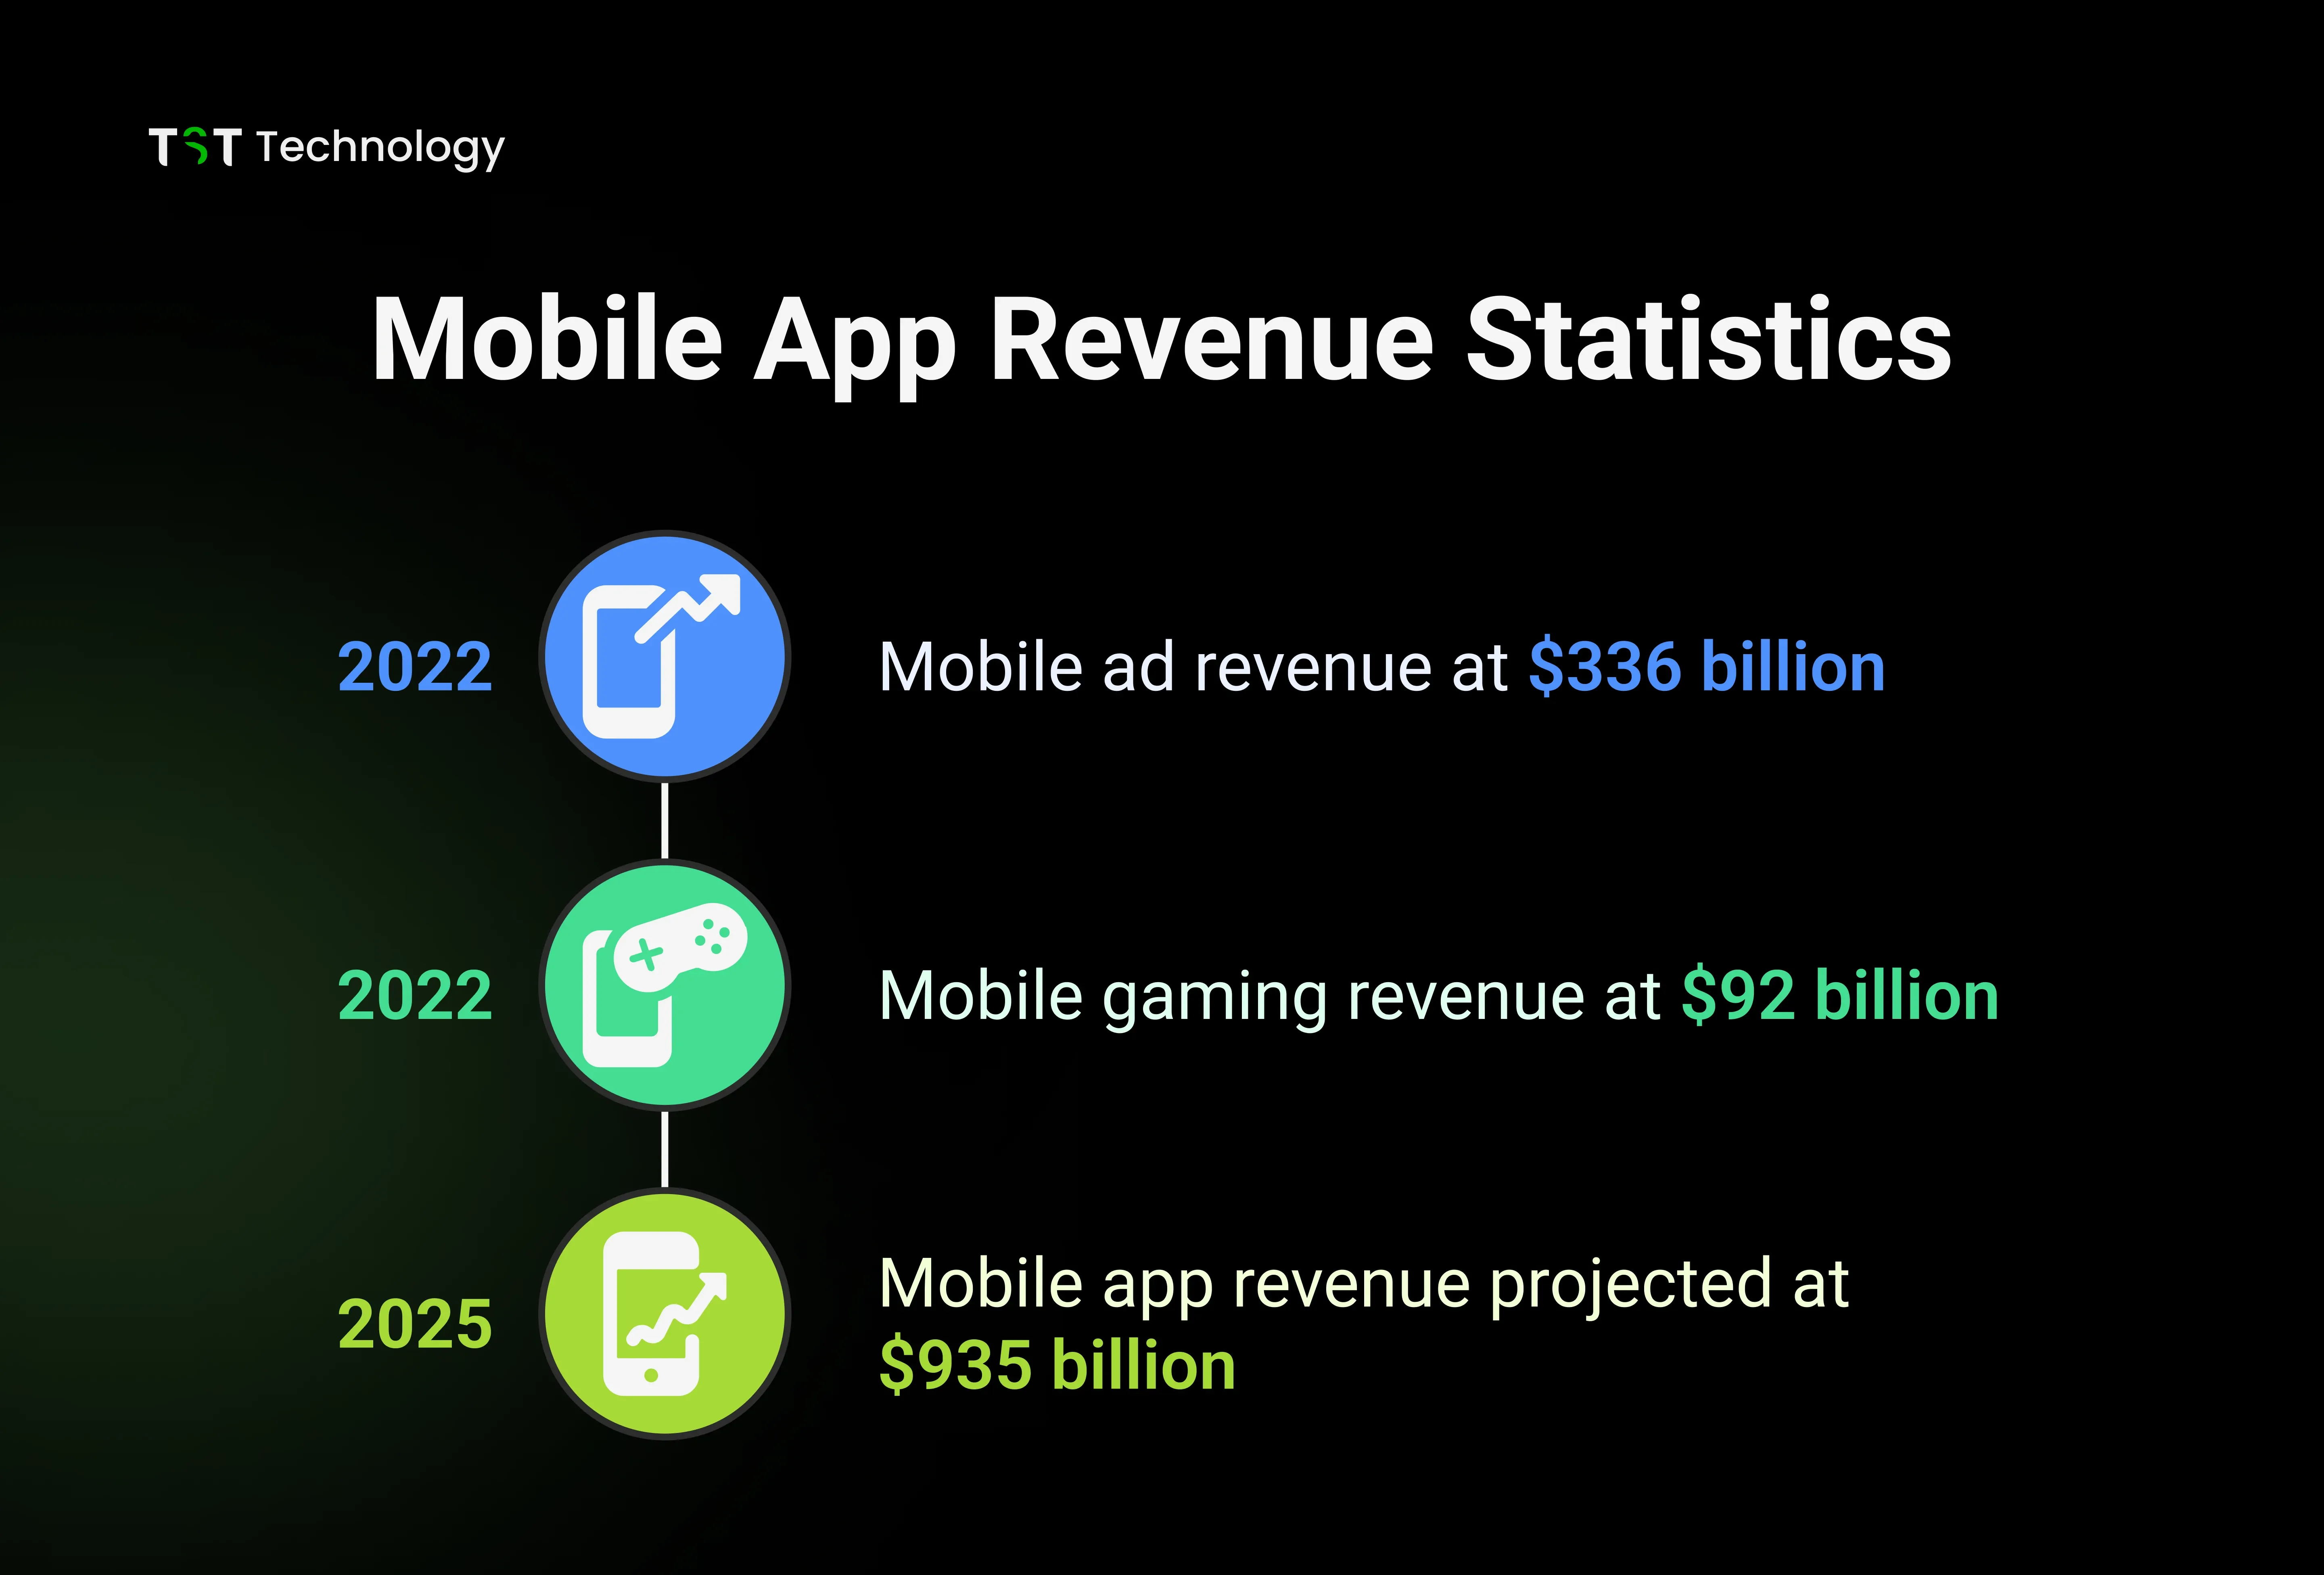
- Mobile app revenue is projected to reach $935 billion by 2025.
- Global mobile app revenue is projected to grow from $522 billion in 2024 to $673 billion by 2027.
- The market is growing at a steady CAGR of 8.58% (2022–2027).
Revenue by Platform: App Store vs Google Play
- Apple App Store revenue reached $85.1 billion in 2023, while Google Play earned $47.6 billion.
- In 2022, Apple’s App Store accounted for half of global consumer app spending, while Google Play made up 27%.
- App Store apps bring in more than double the revenue of Google Play apps.
Gaming Apps: The Top Performers
- Mobile gaming generated $92 billion in 2022, despite a slight 6.4% YoY decline.
- By 2029, mobile gaming revenue is projected to reach $132 billion.
- Games like Candy Crush make up to $4.2 million per day.
- Gaming accounts for 63% of consumer app spending.
In-App Purchases (IAP) & Subscriptions
- In-app purchases generated $205 billion globally in 2022.
- IAPs account for 48.2% of total app revenue, with games taking 66% of that.
- Subscriptions generate 82% of non-gaming app revenue.
- Total subscription revenue reached $17.1 billion in 2022, with 77% from iOS.
Free, Freemium, and Paid App Models
- 97% of Google Play apps and 95% of Apple App Store apps are free to download.
- Yet, free apps are the main revenue drivers. Almost 98% of Google Play’s revenue is generated from ads and in-app purchases within free apps.
- While paid apps exist, their global revenue is limited to $5–7 billion.
- Despite this, mobile app users spent a massive $167 billion globally in 2022, proving that people do pay, just not at the download stage.
Category-Based Revenue Highlights
- Health & fitness apps saw a 120% revenue boost post-pandemic and are expected to hit $6.73 billion by 2027.
- Educational apps generated $38.5 billion globally.
- Meditation apps bring in around $300 million annually.
- Food delivery apps' revenue jumped by 135% since 2020.
- Tinder’s revenue increased by 82% since 2019.
- Disney+ crossed $1.5 billion in mobile revenue faster than any other app.
Mobile Advertising Revenue
- In 2022, mobile ad revenue hit an all-time high of $336 billion, growing by 13.8% YoY.
- Mobile advertising now makes up 73.5% of all online ad revenue.
- Apps like Instagram and TikTok dominate ad-based income, capturing 65% of ad revenue.
Key Takeaways
- Only 0.5% of apps generate significant revenue.
- The top 1% of publishers earn 95% of all mobile app revenue.
- 28% of overall revenue comes from freemium and ad-based models, with in-app purchases and subscriptions leading.
Mobile App Download Statistics
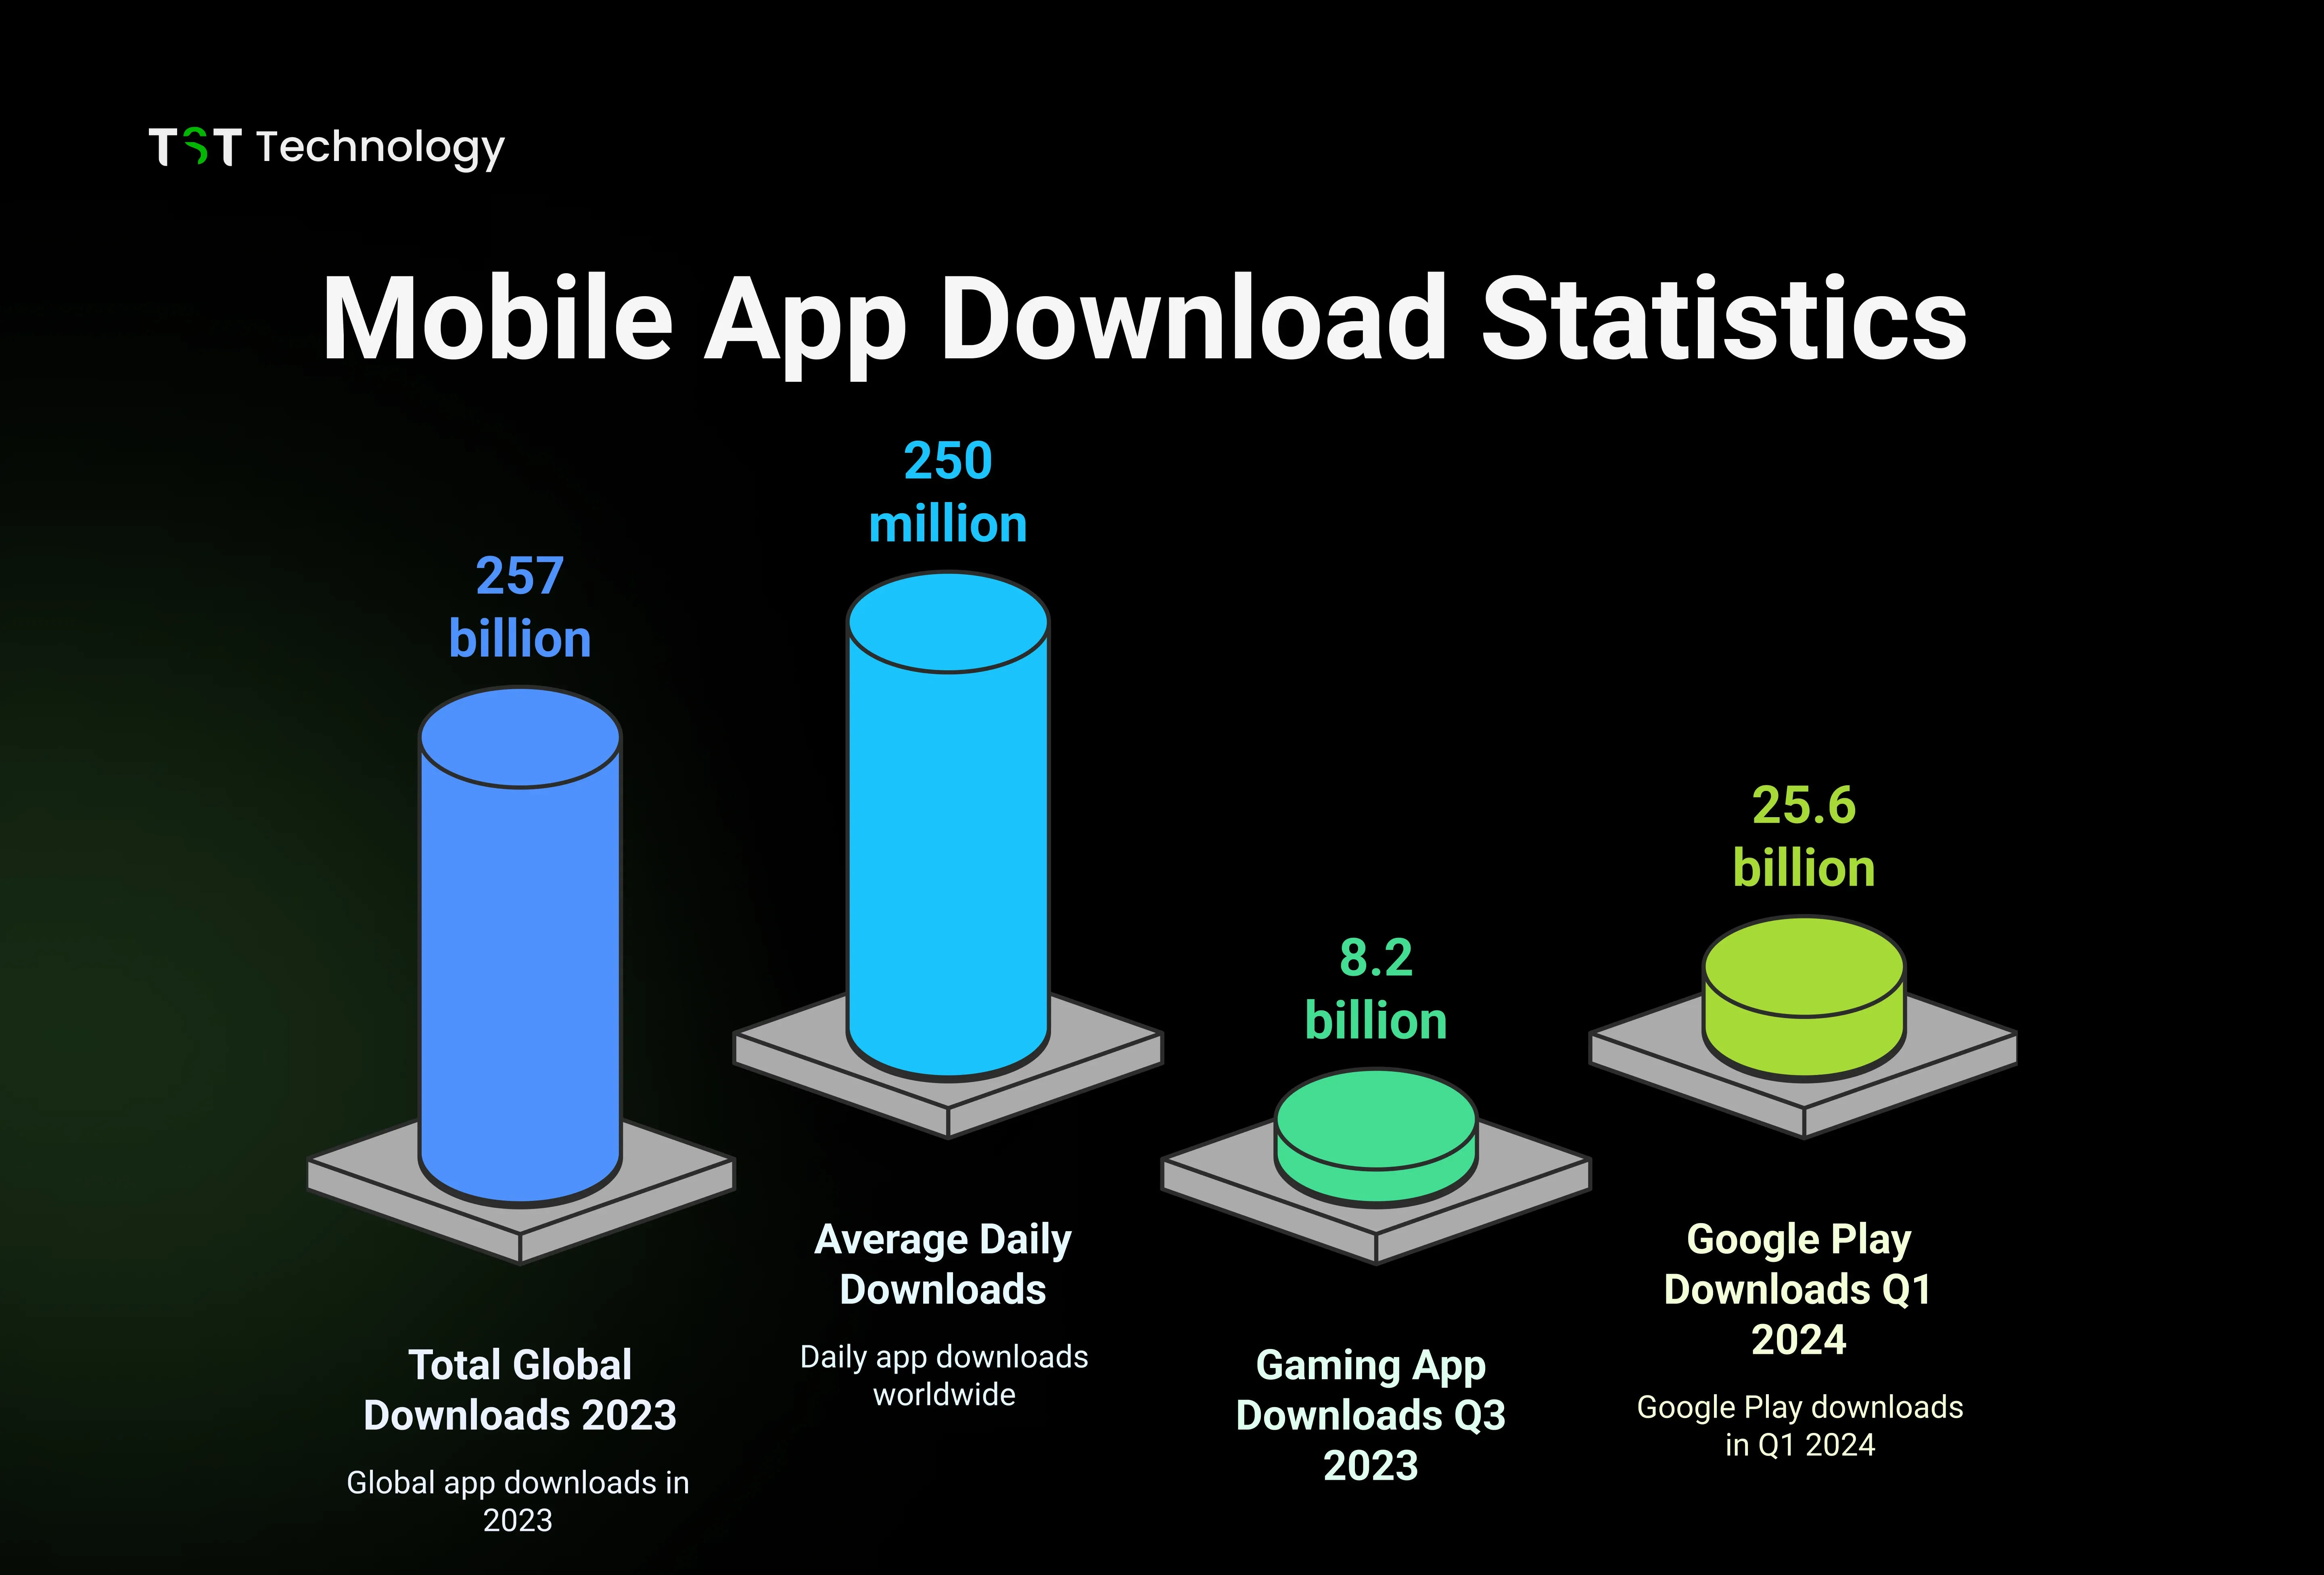
In Q1 2024 alone, users downloaded 25.6 billion apps from Google Play, which is slightly lower than the 27 billion downloads in Q1 2023. On the other hand, Apple’s App Store recorded 8.4 billion downloads in Q1 2024.
Below is a summary of the latest download-related stats to help you understand global app usage better.
| Metric | Value |
| Total App Downloads (2023) | 257+ billion |
| Daily Downloads (Global) | 250 million apps/day |
| Google Play Downloads (Q1 2024) | 25.6 billion |
| Google Play Downloads (Q1 2023) | 27 billion |
| Apple App Store Downloads (Q1 2024) | 8.4 billion |
| Total Google Play Downloads (2023) | 113 billion |
| Total Google Play Apps (2024) | 3.5+ million |
| Total Apple App Store Apps (2024) | 1.6+ million |
| % of Free Apps (Google Play) | 96.93% |
| % of Free Apps (App Store) | 95.09% |
| Top Downloaded App Category (Q3 2023) | Gaming- 8.2 billion downloads |
Global App Download Insights
- In 2023, over 257 billion apps were downloaded worldwide.
- Users are downloading an average of 250 million apps per day globally.
- The global app market is growing at a steady 1% year-over-year rate.
Country & Region Highlights
- India leads in total app downloads, followed by the US and China.
- China ranks highest for mobile app usage and screen time.
- Brazilian users download 12 new apps per month on average.
App Category-Specific Downloads
- Gaming apps are the most downloaded globally, with 8.2 billion downloads in Q3 2023.
- Photo & Video apps follow with nearly 20 billion annual downloads.
- Educational apps have seen an 85% rise in downloads since the pandemic.
- Finance apps have grown 160% compared to pre-COVID times.
- Dating apps saw 95% growth, with Tinder processing 1.6 billion swipes/day.
Mobile App Retention Rates (Key Industry & Usage Insights)
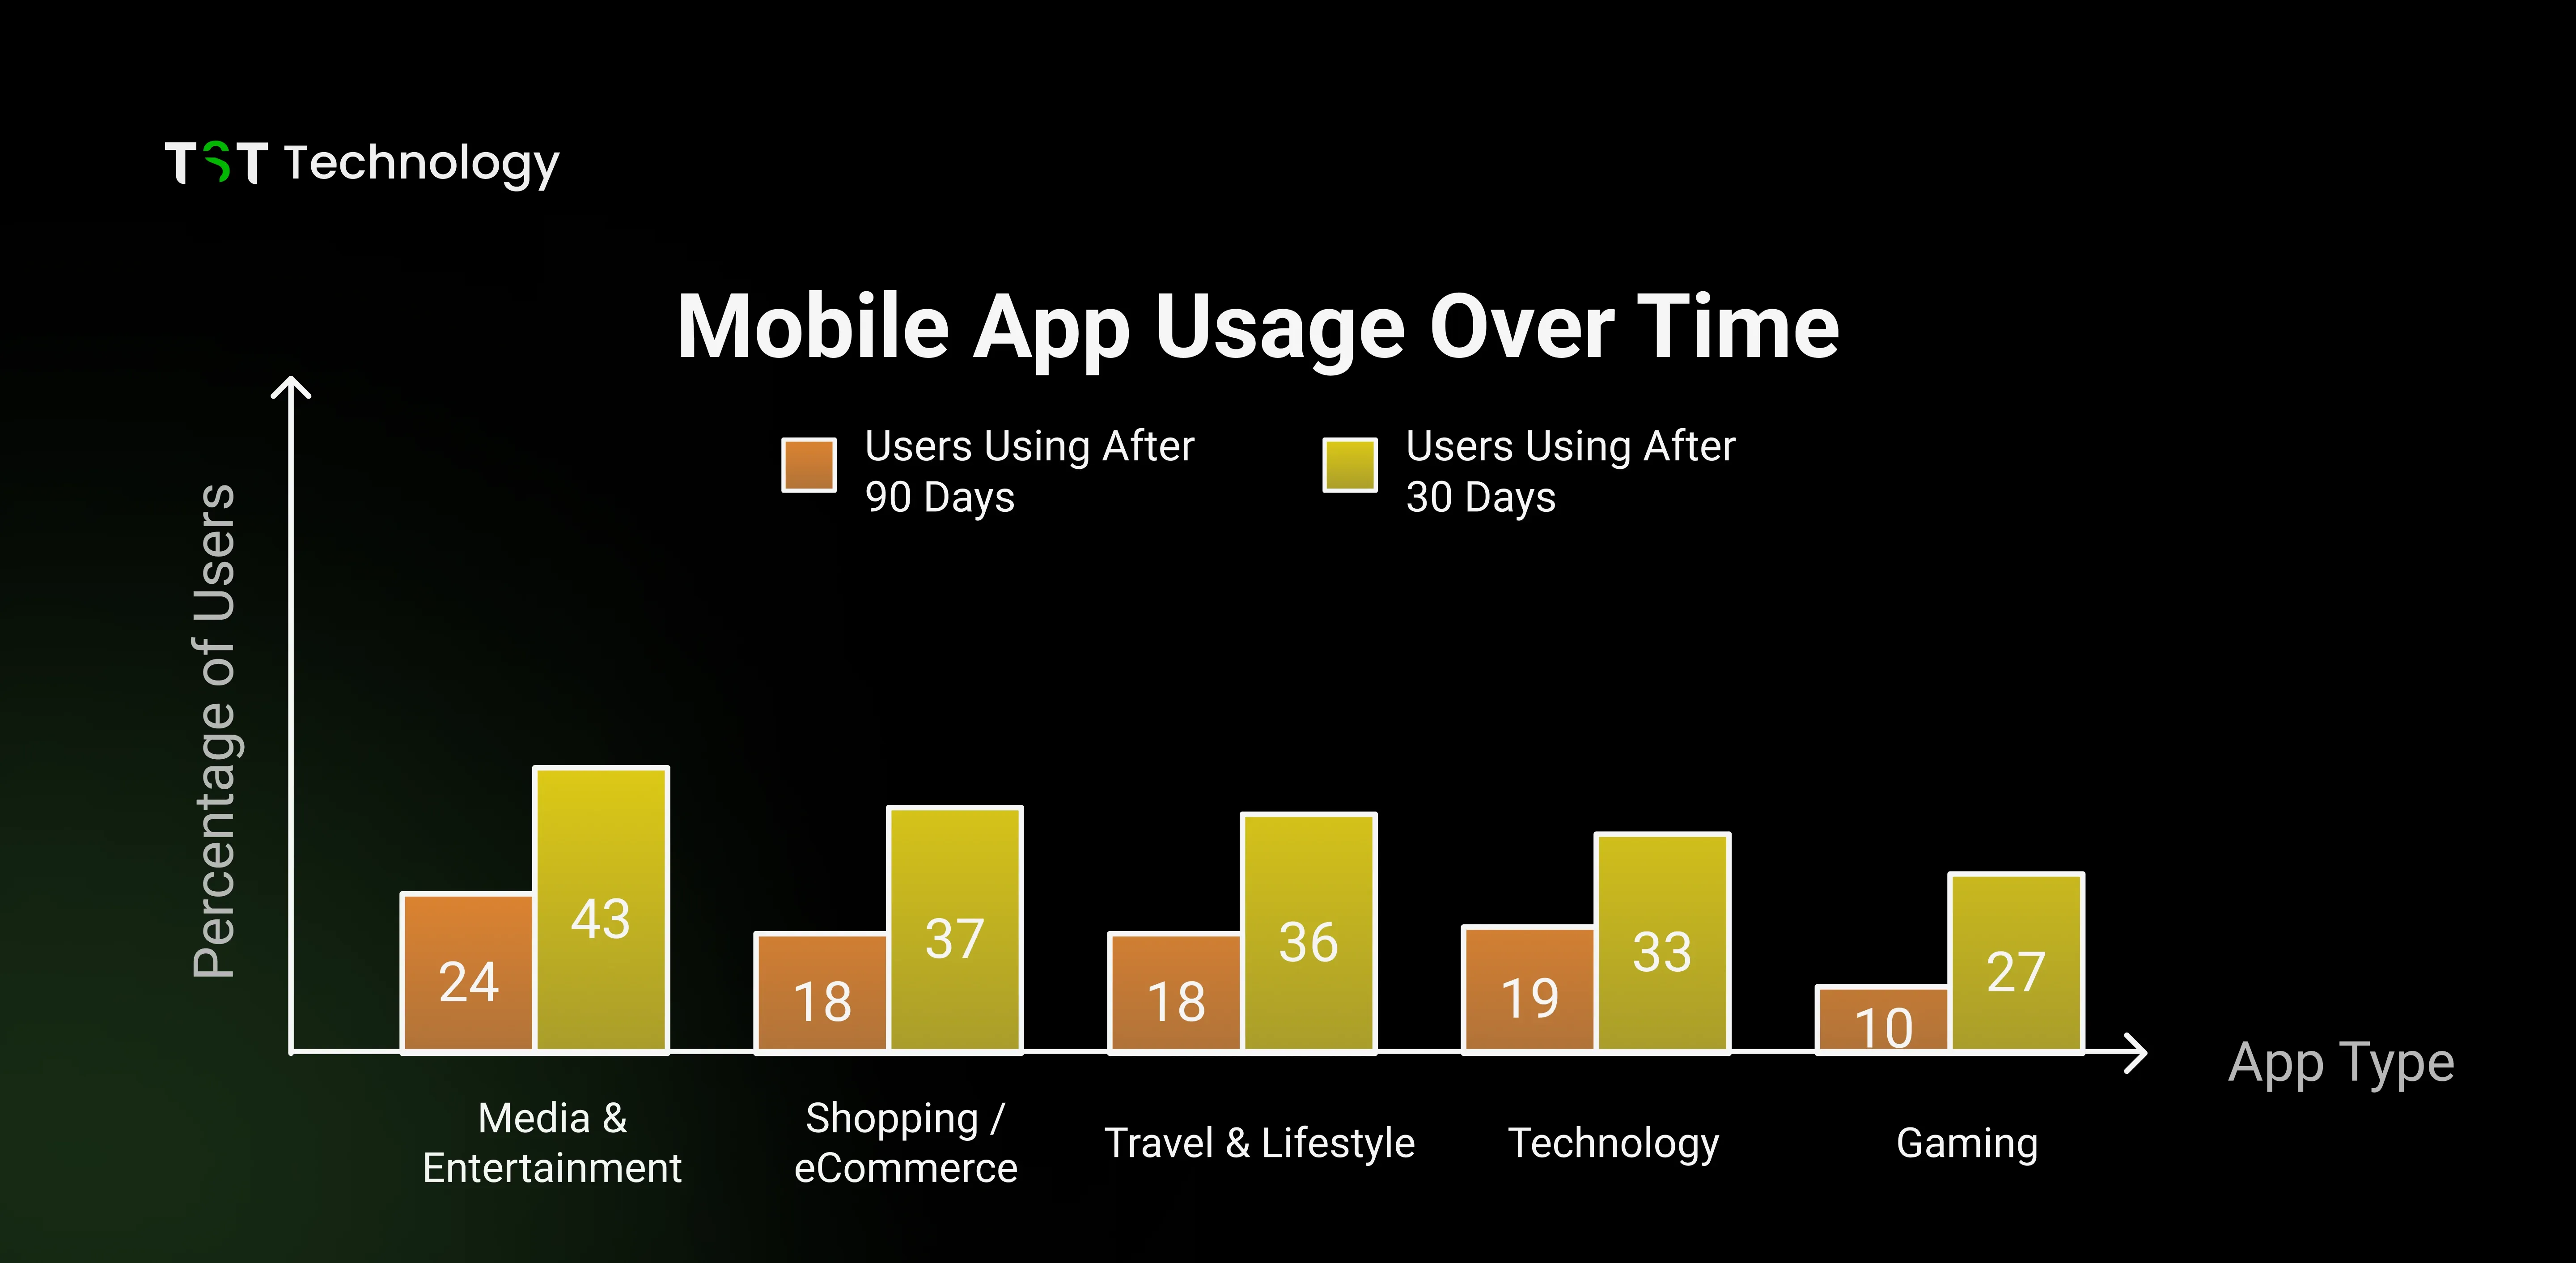 Retention Rate Highlights
- 25% of users stop using an app after just 1 day.
- 72% of users stop using an app after 30 days.
- In Japan, app users keep apps the longest (5.1% retention rate).
- In China, app users stop using apps the fastest (only 1.3% retention).
- News apps have a 9.1% retention rate after 30 days (best among categories).
- Social media apps have a very low retention rate after 30 days (only 1.37%).
- Gaming apps lose most users fast: 94% of players stop playing within 1 month.
- Shopping apps lose 80% of users within 1 week.
- Finance apps keep 35% of users after 30 days.
- Sending 3 push notifications a week helps keep more users (up to 190% more retention).
- Android 30-day retention rate: 2.6%; iOS: 4.3%.
- Sending notifications at night (like 3 AM) makes users less active (37% drop).
- Users who finish onboarding (getting started) quickly (under 1 minute) are 50% more likely to keep using the app.
- Apps that work well in short moments (like waiting in line or a coffee break) keep 40% more users.
- TikTok users spend 95 minutes every day on the app, showing high engagement.
- Productivity apps are used less, about 4.6 minutes per session.
AI & Emerging Technologies Revolutionizing Mobile Apps
The integration of artificial intelligence and next-generation technologies is fundamentally transforming the mobile app landscape in 2025.
AI-Enabled Apps Surge
- AI app downloads surged from near-zero in early 2022 to over 1.5 billion in the first half of 2025
- In-app purchase revenue for AI-enabled apps reached nearly $1.8 billion in H1 2025 alone
- AI apps are experiencing 112% year-over-year growth, the largest among all app categories
- 40% of consumer spending among top AI apps goes to General Assistant applications
ChatGPT: A Mobile App Success Story
ChatGPT has shattered mobile app records:
- Became the fastest app to reach 1 billion global downloads (July 2025)
- First app (excluding pre-installs) to reach 500 million monthly active users
- Downloaded 410.8 million times globally in just the first 9 months of 2025
- Held #1 position in app stores for 7 consecutive months (March-September 2025)
- Users send 2.5 billion prompts daily, equivalent to 29,000 messages per second
- Generated $2 billion in mobile revenue to date, earning $2.91 per install
AI App Market Leaders
Top AI apps by downloads (2025):
- ChatGPT: 410.8 million downloads
- Google Gemini: 131.1 million downloads
- DeepSeek: 79.2 million downloads
- Grok: 46.6 million downloads
- Perplexity: 43.1 million downloads
Conclusion
As you’ve seen, the mobile app industry is growing at lightning speed, from downloads to evolving user behavior and shifting retention trends. These stats not only highlight user preferences but also give businesses a roadmap to build smarter, more engaging apps in 2025.
Need expert help with mobile app development or want to optimize your existing app? Contact us, we’re always here to help you!
Thanks for reading till the end, stay tuned for more tech insights! See you again in the next blog!


